
|
|
|
|
|
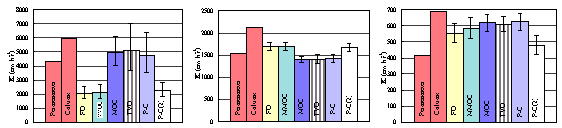
A comparison of solute-transport solution techniques based on inverse modelling resultsSTEFFEN MEHL & MARY C. HILLU.S. Geological Survey, 3215 Marine St., Boulder, Colorado, 80302, U.S.A; Civil, Environmental, and Architectural Engineering, University of Colorado, Boulder email: mehlsw@bechtel.colorado.edu 1999, IAHS Publication no. 265 ABSTRACT Five common numerical techniques (finite-difference, FD; predictor-corrector, P-C; total-variation-diminishing, TVD; method-of-characteristics, MOC; and modified-method-of-characteristics, MMOC) were tested using simulations of a controlled conservative tracer-test experiment through a heterogeneous, two-dimensional sand tank. The experimental facility was constructed using randomly distributed homogeneous blocks of five sand types. This experimental model provides an outstanding opportunity to compare the solution techniques because of the heterogeneous hydraulic-conductivity distribution of known structure and the availability of detailed measurements with which to compare simulated concentrations. The present work uses this opportunity to investigate how three common types of results -- simulated breakthrough curves, sensitivity analysis, and calibrated parameter values -- change in this heterogeneous situation given the different methods of simulating solute transport. The results show that simulated peak concentrations, even at very fine grid spacings, varied because of different amounts of numerical dispersion. Sensitivity analysis results were robust in that they were independent of the solution technique. They revealed a high correlation between hydraulic conductivity and porosity, and that the breakthrough curve data did not provide enough information about the dispersivities to estimate individual values for the five sands. However, estimated hydraulic conductivity values are significantly influenced by both the large possible variations in model dispersion and the amount of numerical dispersion present in the solution technique.
mchill@usgs.gov Last Modified: August 15, 2000 |