Ground Water Hydrology
This page provides supporting material for the text book
Estimating Groundwater Recharge,
with contributions by
Problem 6.1
Freeze and Banner
(1970) studied groundwater recharge processes at three sites in the Figure 6A shows rainfall and depth to
water table for site A for 25 days during July and August 1966. Figure 6B shows
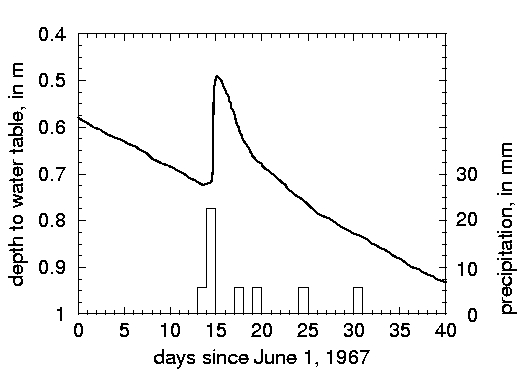
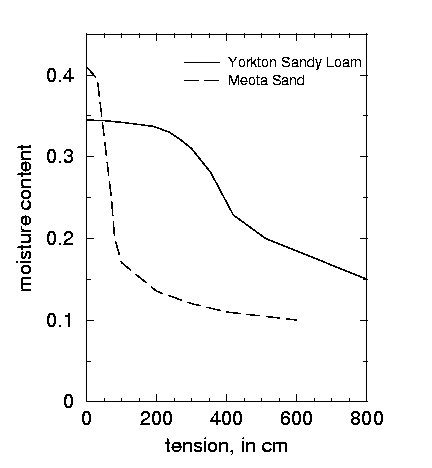
precipitation and water-level rise at site B for parts of June and July 1967. The
water-retention curves for Problem 6.1A For site A, estimate values of specific
yield, Sy by using Equation (6.5). Describe how
Sy varies as a function of depth to the water table (Hd). Compare estimates of Sy with those for
generic soils with similar texture (Table 6.4). Apply the water-table
fluctuation method (Equation 6.2) to estimate the total amount of recharge.
Explain how the recession curve was approximated. Problem 6.1B
For site B, estimate values of Sy by using Equation
(6.5). The magnitude of the saturated hydraulic conductivity for the Meota sand
was measured at 1.67x10⁻⁶ m/s. Apply the Nachabe
(2002) method (Equation 6.8) to estimate Sy for site B. This will require estimating the parameters of the Brooks-Corey
water-retention curves (see Problem 5.1). How do calculated values of Sy compare with those in
Table 6.4? Apply the water-table fluctuation method (Equation 6.2) to estimate
the total amount of recharge. Discuss the differences in water-table reponses
and recessions for the two events. How do the estimates of recharge compare
with measured precipitation? What could contribute to the more rapid rise in
water table at site B? Figure 6A Figure 6B Figure 6C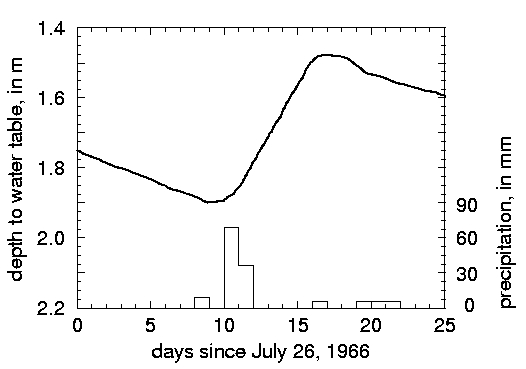
References
Freeze, R.A., and Banner, J., 1970, The mechanism of natural groundwater recharge and discharge: Laboratory column experiments and field measurements, Water Resources Research, vol. 6, p. 138-155.
|
|

![]() U.S. Department of the Interior |
U.S. Geological Survey
U.S. Department of the Interior |
U.S. Geological Survey
URL:www/projects/GW_Unsaturated_Zone_Field Studies/Recharge_Book/index.htm
Book Contact
Information: Richard
W. Healy
Page Contact Information: Charmaine Gunther
Page Last Modified: February 18, 2011
