ΔGtot = ΔGads + zFψ, (21)
where ΔG is the Gibbs energy (J/mol), z is the charge number (unitless) of the sorbed species, F is the Faraday constant (96,485 C/mol), ψ is the potential (V), and subscripts tot and ads indicate total and chemical adsorption energy, respectively. Sorption is stronger when the Gibbs energy decreases. Thus, a counter-ion that carries a charge opposite to the surface charge tends to be sorbed electrostatically, while a co-ion that carries a charge with the same sign as the surface tends to be rejected.
PHREEQC has two models for surface complexation. One is based on the Dzombak and Morel (1990) database for complexation of heavy metal ions on hydrous ferric oxide (Hfo), or ferrihydrite. Ferrihydrite, like many other oxy-hydroxides, binds metals and protons on strong and weak sites and develops a charge depending on the ions sorbed. The model uses the Gouy-Chapman equation to relate surface charge and potential.
The other model is CD-MUSIC, which also can accommodate multiple surface sites. In addition, the charge, the potential, and even the sorbed species can be distributed over two additional planes in the double layer that extends from the surface into the free (electrically neutral) solution. The CD-MUSIC model has more options to fit experimental data and initially was developed for sorption on goethite, but has been applied to many metal-oxide surfaces. An example is given in the PHREEQC Help file, which is available by installing http://www.hydrochemistry.eu/phreeqc.chm.exe (accessed June 25, 2012).
Neither of the models considers that a charged surface, when centrifuged and separated from a solution, must have a shell of co- and counter-ions that compensates the surface charge in an electrical double layer (EDL). However, PHREEQC can integrate the concentrations in the diffuse layer ( -diffuse_layer ), or calculate the average concentrations with the Donnan option ( -Donnan ). It also is possible to ignore the electrostatic contribution by use of the identifier -no_edl . This non-electrostatic model does not consider the effects of the development of surface charge on the formation of surface complexes, with the result that surface complexes are treated mathematically, much like aqueous complexes.
The following example of the Gouy-Chapman model is taken from Dzombak and Morel (1990, chapter 8). Sorption of zinc on hydrous ferric oxide is simulated by using weak and strong sites on the oxide surface. Protons and zinc ions compete for the two types of binding sites, which is described by mass-action equations. The equations take into account the dependence of the activities of surface species on the potential at the surface; in turn, the potential at the surface is related to the surface charge by the Gouy-Chapman relation. The example considers the sorption of zinc on hydrous ferric oxides as a function of pH for low (10 -7 mol/kgw) and high (10 -4 mol/kgw) zinc concentration in 0.1 mol/kgw sodium nitrate electrolyte.
Three keyword data blocks are required to define surface-complexation data for a simulation: SURFACE_MASTER_SPECIES, SURFACE_SPECIES, and SURFACE. The SURFACE_MASTER_SPECIES data block in the default database files defines a surface named “Hfo” (hydrous ferric oxides) with two binding sites. The name of a binding site is composed of a name for the surface, “Hfo”, optionally followed by an underscore and a lowercase binding site designation, here “Hfo_w” and “Hfo_s” for “weak” and “strong”. The underscore notation is necessary only for surfaces with two or more binding sites. The notation allows a mole-balance equation to be derived for each of the binding sites (Hfo_w and Hfo_s, in this example). The charges that develop on the two binding sites are summed, and the total is used to calculate the potential at the surface.
Surface-complexation reactions derived from the summary of Dzombak and Morel (1990) are defined by the SURFACE_SPECIES in the default database files for PHREEQC. However, the intrinsic stability constants used in this example of Dzombak and Morel (1990, chapter 8) differ from these summary values, and are therefore specified explicitly with a SURFACE_SPECIES data block in the input file (table 27). The reactions are taken from Dzombak and Morel (1990, p. 259) and entered in the input file (table 27). Note that the activity effect of the potential term is not included in the mass-action expression but is added internally by PHREEQC.
The composition and other characteristics of an assemblage of surfaces are defined with the SURFACE data block. For each surface, the moles of each type of site and the surface area must be defined. In the input file, all the surface sites initially are in the uncharged, protonated form. Alternatively, the surface can be initialized to be in equilibrium with a solution with -equilibrate solution_number. In both cases, the composition of the surfaces will vary with the extent of subsequent reactions.
The number of binding sites and surface areas may remain fixed or may vary if the surface is related to an equilibrium phase or a kinetic reaction. In this example, the number of strong binding sites (Hfo_s, 5×10 -6 mol) and of weak binding sites (Hfo_w, 2×10 -4 mol) remain fixed. With -sites_units density, the number of sites per nm2 (square nanometer) may be entered, instead of moles. The surface area must be defined with two numbers, the area per mass of surface material (here, 600 m 2 /g) and the total mass of surface material (here, 0.09 g). The use of these two numbers is traditional, but only the surface area obtained from the product of the numbers is used to determine the specific charge and the surface potential. The surface area may be entered with any of the binding sites for a surface; in table 27, the surface area is entered with Hfo_s.
Two sodium nitrate solutions are defined with different concentrations of zinc (SOLUTION 1 and 2 data blocks), which can be recalled later in the run by USE solution 1 or 2. Together with the definitions of these solutions, USER_PUNCH is used to generate a PHREEQC input file, as explained in the next paragraph. A pseudo-phase, “Fix_H+” is defined with the PHASES data block. This phase is not real, but is used in the batch-reaction simulations to fix the pH at specified values.
The remaining simulations in the input file equilibrate the surface with either solution 1 or solution 2 for pH values that range from 5 to 8. It is possible to use the REACTION data block to add or remove varying amounts of NaOH from the solution in a single simulation, but the reaction increments will not produce evenly spaced pH values and the size of the reaction increments is not known beforehand. Alternatively, evenly spaced pH values can be obtained by using the phase “Fix_H+” in an EQUILIBRIUM_PHASES data block; the saturation indices correspond to the desired pH. A separate simulation is needed for each pH, illustrated here for pH = 5.
USE solution 1
USE surface 1
EQUILIBRIUM_PHASES 1
Fix_H+ -5 NaOH 10.0
END
Writing a similar set of data blocks for each pH is easy, but tedious. However, a shortcut is available. The simulations can be generated with a small Basic program in keyword USER_PUNCH and punched to the files zn1e_7 and zn1e_4. The Basic program punches a string, a$, that contains the PHREEQC keywords and instructions for each pH, which is set by the FOR-loop variable i. EOL$ is a function that returns a new-line character. During the run, the files are inserted in the input file with INCLUDE$ zn1e_7 and INCLUDE$ zn1e_4.
NaOH is added or removed from each solution to produce the specified saturation index for “Fix_H+” or log activity of H+ (which is the negative of pH). However, a very low pH may not be attainable by removing all of the sodium from the solution. In this case HNO3 should be used as reactant instead of NaOH.1
The results of the simulation are plotted in figure 9 and are consistent with the results shown in Dzombak and Morel (1990, figure 8.9). Zinc is more strongly sorbed at high pH values than at low pH values. In addition, at low concentrations of zinc, the strong binding sites outcompete the weak binding sites for zinc over the entire pH range, and at high pH, most of the zinc resides at the strong binding sites. At larger zinc concentrations, the strong binding sites predominate only at low pH. Because all the strong binding sites become filled at higher pH, most of the zinc resides at the more numerous weak binding sites at high pH and large zinc concentrations.
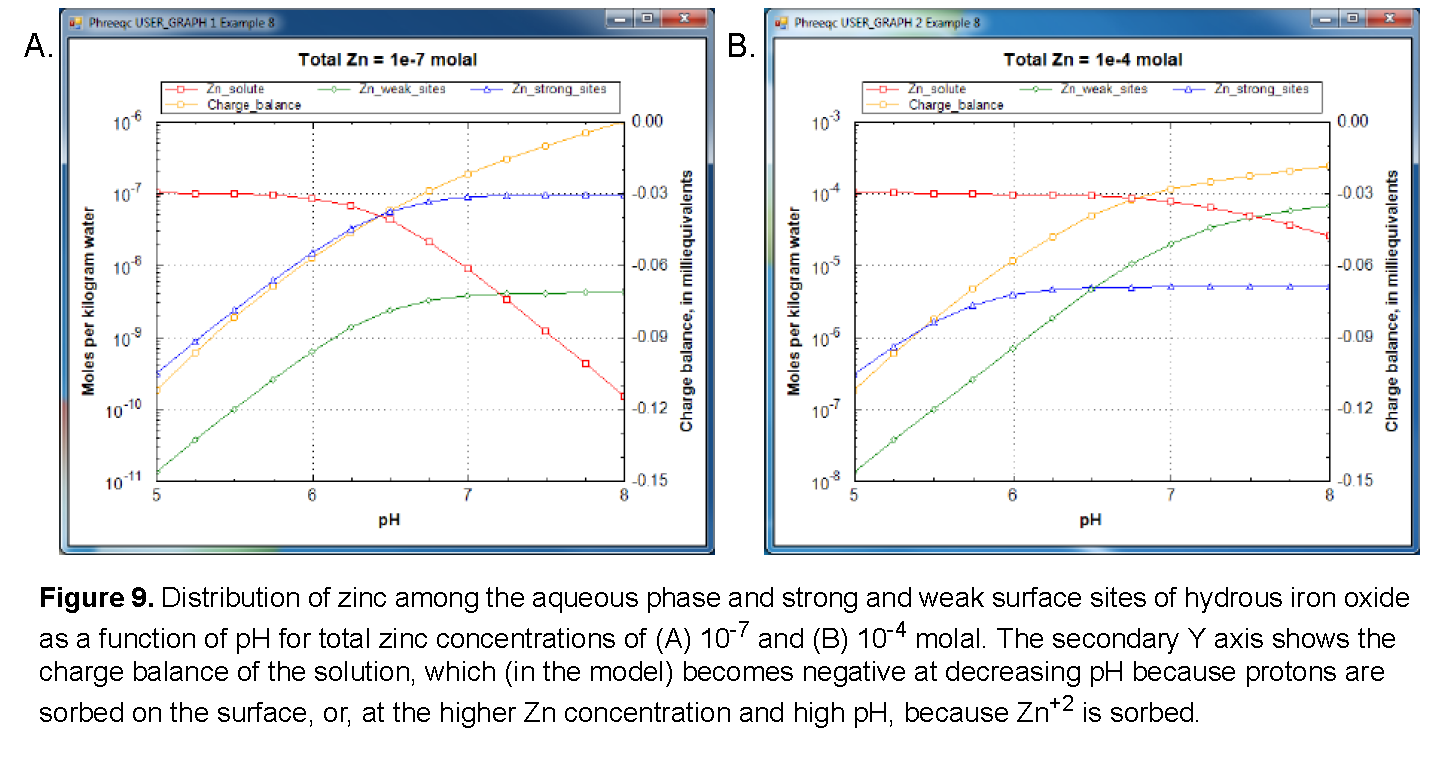
There is one more point to be noted in figure 9. The charge balance of the solution, plotted on the secondary Y axis, becomes negative with decreasing pH because the surface sorbs protons from the solution. If the solution and surface are separated (for example by TRANSPORT or by a SAVE and subsequent USE), the surface will keep its positive charge, and the solution its negative counter-charge. Such a separation of electrical charge is physically impossible. In reality, an electrical double layer exists on the surface that counterbalances the surface charge, and which remains with the surface when surface and solution are separated, thus keeping both of them electrically neutral. If the identifier -Donnan is added in keyword SURFACE, the composition of the electrical double layer is calculated and stored with each of the surfaces in the assemblage; this explicitly calculated electrical double layer makes each surface a neutral entity. In the input file this option (-Donnan) can be uncommented, resulting in a zero charge balance when the file is run again.